Het aandeel Yellow Cake heeft een Koers/Winst verhouding van 3,5.
Toch is het aandeel Yellow Cake maar niet zo maar koopwaardig. In de video leg ik uit waarom.
Het is overigens een opmerkelijk bedrijf. Ze hebben namelijk slechts twee medewerkers!
Dat mag toch wel zeer opmerkelijk genoemd worden voor een bedrijf met een beurswaarde van 833 miljoen dollar.
Kijk hier naar de video

Category:
Beurs Aandelen Analyses
Vlagpatroon in uraniumkoers grafiek
Technisch gezien is er een interessant patroon in de grafiek van uranium ontstaan.
U ziet het hier

Dit is een vlagpatroon en het interessante daar aan is dat er binnenkort een richting bepaald gaat worden.
Hoe dan ook komt er namelijk een uitbraak en vaak is de richting van de uitbraak een indicatie voor de toekomst.
Logisch zou een opwaartse uitbraak zijn, maar logisch en de beurs zijn niet altijd de beste vrienden van elkaar.
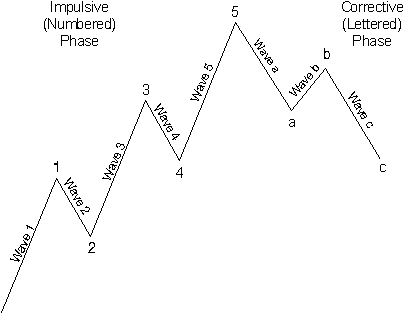
In late 2021, Elliott Wave International Founder and President Robert Prechter gave a rare, live presentation — “A Stock Market Top for the Ages” — at the annual New Orleans Investment Conference. The recording comprises Prechter’s December 2021 Elliott Wave Theorist.
And now our friends at EWI are sharing it with you free ($99 value).
In just 20 minutes, Prechter shows 28 charts — everything from penny stocks to dollar volume in IPOs to SPACs — to give you a clear, bird’s-eye view of today’s markets.
“Unbelievable” is the word he uses to describe several of these charts.
This video sells for $99 in EWI’s Store. You get it FREE with this coupon code: STOCKTOP. You need to simply enter the code once you click on the link below and join free Club EWI to watch.
Free, watch “A Stock Market Top for the Ages” with code STOCKTOP now >> Click here
Ik heb dit aandeel al eerder besproken. Een concessie zo groot als België, Noord-Brabant en Zeeland samen en een bodemstructuur zoals onder de beste olie en gashoudende regio’s in de wereld, waaronder de Permian basin in de VS en ons eigen Groningen.
Het is de laatste weken stil rond het aandeel. Advocaten hebben December gebruikt om zieltjes te winnen voor een rechtszaak tegen het bedrijf.
Nieuws van het bedrijf was er niet. De koers ligt al enige tijd stil.
Kortom een mooi moment om eens te gaan kijken.
Je kan dat hier doen:
De AEX sloot vrijdag op een stand van 788,43.
Belangrijk, want dat is lager dan de openingskoers op de eerste handelsdag van 2022.
Dit wil dus zeggen dat volgens de Eerste 5 handelsdagen methode 2022 een negatief jaar voor de AEX index gaat worden!
Hoe ‘zeker’ is dat?
In feite kan ik daar kort over zijn. Niet.
Maar…
Deze methode heeft het in ongeveer 84% van alle jaren goed.
Ik zou het dus ook weer niet helemaal willen negeren.
Kijk hier naar eerdere jaren waarin ik dit bij heb gehouden.
Vanochtend las ik een heel positief artikel over het aandeel. De analist Laurent Grandet van Guggenheim ziet sterke emerging markets voor het bedrijf. Het herstel van de omzet gaat sneller dan verwacht en de organisatie heeft zich de afgelopen tijd herpakt en gereorganiseerd. Daarbij zijn de marges groter geworden en is men gaan denken over het afstoten van minder winstgevende onderdelen van de onderneming.
Hij heeft dus een koopadvies met een koersdoel van $66.
Dat ziet er dus mooi uit.
Maar dan nu de huidige koers…
Die is nu al $60.
In feite hebben we het dus over een heel mooi aandeel, maar een koerspotentieel van 10%.
Nu is Coca Cola een enorm goed bedrijf, maar een 10% koerspotentieel is bijzonder mager te noemen. Is dat dan zo’n fantastische tip van hem?
Ik vind het eigenlijk zonde van de Internet ruimte.
Immers Coca Cola is zo’n mooi bedrijf dat je dat bedrijf ieder jaar wel een 10% koerspotentieel kan meegeven. Zonder ook maar een woord over het bedrijf te schrijven.
Was hij nu een maand geleden met dit gratis advies gekomen, dan was het mooier geweest. Toen stond dit aandeel nog op 52,5. ALs je dan zegt dat het 66 kan worden, dan gaat het nog ergens over.
Wat ik dus denk (en dan ben ik positief voor hem) is dat hij voor zijn betaalde klanten dicht bij de 52,5 met dit advies kwam. Nu de koers nog even een zetje geven door het ‘gratis’ op TV en Internet te roepen en je analyse komt uit en je betaalde klanten zijn bijzonder tevreden met je.
Dát is er naar mijn idee gaande.
Learn about the “head and shoulders” measuring formula
By Elliott Wave International
You are probably familiar with the classic “head and shoulders” chart pattern.
But, in case you need a refresher, here’s a brief description of a head and shoulders top:
The high of an initial upward move is the left shoulder. After a decline, another upward move takes prices to a higher high, or the head. A second decline follows the head. A third rally then takes prices to a peak below the high of the head, and becomes the right shoulder. The left and right shoulders are often similar in duration and extent. A trendline connecting the two lows is called the neckline. When prices penetrate the neckline, a change of trend is believed to have occurred.
Head and shoulders bottoms also occur and the same description applies except in reverse.
This head and shoulders measuring formula — showing a top as an example — provides even more insight. The commentary is from a past issue of Elliott Wave International’s Trader’s Classroom:

To identify a high-probability price target for the move following the break of the Neckline, measure the distance between the Head and the Neckline and then project that distance down from the point at which the Right Shoulder breaks the Neckline.
The July 2021 Global Market Perspective, a monthly publication which provides coverage of major global financial markets, applied this knowledge to a forecast for the euro.
The chart on the left is from that July issue of the Global Market Perspective and the chart on the right was updated for the December Global Market Perspective. Here’s what the December Global Market Perspective said:

A relentless four-month decline pulled the euro slightly below our downside target of $1.1263 on November 19, as these before-and-after charts show. On November 24, the euro bounced from its $1.1185 low. …
You can learn about other classic chart patterns by reading Frost & Prechter’s Elliott Wave Principle: Key to Market Behavior. Here’s a quote from the book:
The Elliott Wave Principle not only supports the validity of chart analysis, but it can help the technician decide which formations are most likely of real significance.
Get the details of how the Wave Principle “supports the validity of chart analysis” by reading the entire Wall Street classic for free!
That’s right — you can get unlimited and free access to the online version of Elliott Wave Principle: Key to Market Behavior by simply joining Club EWI — the world’s largest Elliott wave educational community.
Don’t worry — Club EWI members are not under any obligations — yet, members do enjoy free access to a wealth of Elliott wave resources on investing and trading.
Current resources available to Club EWI members include the report, “Crypto Trading Guide: 5 Simple Strategies” and the new video offering “Apply This Technique to Stop Rushing into Trades.”
Plus, as mentioned, free access to Elliott Wave Principle: Key to Market Behavior (just click on the highlighted link to have this Wall Street classic on your computer screen in moments).
This article was syndicated by Elliott Wave International and was originally published under the headline Euro: Look at This Head & Shoulders Chart Formation. EWI is the world’s largest market forecasting firm. Its staff of full-time analysts led by Chartered Market Technician Robert Prechter provides 24-hour-a-day market analysis to institutional and private investors around the world.