We zien de laatste weken een structurele daling in de AEX index. Iedere top is lager, maar ieder dal ook. De steun ligt rond de 500 punten. Er is overigens ook een zwakkere steun rond de 530 te vinden.

We zien de laatste weken een structurele daling in de AEX index. Iedere top is lager, maar ieder dal ook. De steun ligt rond de 500 punten. Er is overigens ook een zwakkere steun rond de 530 te vinden.
As you probably know, a “divergence” occurs when one financial market behaves differently from a related financial market.
Such occurrences often portend trend changes, albeit, divergences may stretch out for months before a trend change occurs.
Remarkably, one global divergence has been unfolding for more than 20 years!
The September Global Market Perspective, a monthly publication which covers financial markets in Europe, the Asian-Pacific, the U.S. and other regions, tells the story with this chart and commentary:

Incredibly, Europe’s broad market has made no net progress over the past 15 long months, as this chart of the past 25 years shows. More incredibly, the Stoxx 600 is lower today than it was in March 2000, almost 21 years ago. Perhaps most incredibly, however, is that the great U.S.-European stock market divide has grown even wider. The S&P 500, in fact, has more than doubled since March 2000 and more than quintupled since the last financial crisis ended in March 2009.
Can this 20-plus year divergence continue?
Well, here’s what U.S. News & World Report had to say on August 4:
Europe May Finally Be Compelling for Investments
It’s time for U.S. investors to change their outlook on European investments.
On August 9, the Wall Street Journal expressed a similar sentiment:
Why It Might Be Time to Invest in Non-U.S. Stocks
U.S. stocks have been the better bet for a decade. With those valuations now so high, the question is whether it makes sense to shift some exposure overseas.
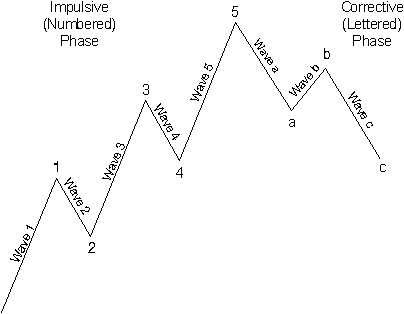
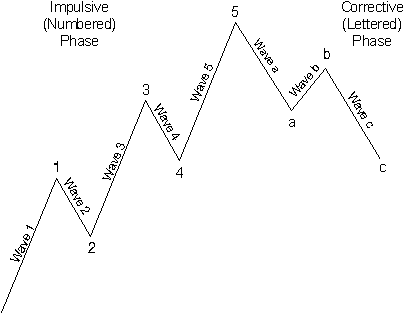
Also, the Global Market Perspective is filled with Elliott wave analysis of 40-plus markets worldwide.
An ideal way of learning how to analyze and forecast financial markets by using the Elliott wave model is to read the Wall Street classic, Elliott Wave Principle: Key to Market Behavior, by Frost & Prechter.
Here’s a quote from the book:
All waves may be categorized by relative size, or degree. The degree of a wave is determined by its size and position relative to component, adjacent and encompassing waves. [Ralph N.] Elliott named nine degrees of waves, from the smallest discernible on an hourly chart to the largest wave he could assume existed from the data then available. He chose the following terms for these degrees, from largest to smallest: Grand Supercycle, Supercycle, Cycle, Primary, Intermediate, Minor, Minute, Minuette, Subminuette. Cycle waves subdivide into Primary waves that subdivide into Intermediate waves that in turn subdivide into Minor waves, and so on. The specific terminology is not critical to the identification of degrees, although out of habit, today’s practitioners have become comfortable with Elliott’s nomenclature.
The online version of Elliott Wave Principle: Key to Market Behavior is freely available to Club EWI members. Club EWI is the world’s largest Elliott wave educational community and is free to join. In addition to free access to Elliott Wave Principle: Key to Market Behavior, Club EWI membership allows you to access a wealth of Elliott wave resources on financial markets, trading and investing – free.
Follow the link to get your free access to Elliott Wave Principle: Key to Market Behavior.
This article was syndicated by Elliott Wave International and was originally published under the headline Global Stock Markets: Keep Your Eye on This Remarkable “Divergence”. EWI is the world’s largest market forecasting firm. Its staff of full-time analysts led by Chartered Market Technician Robert Prechter provides 24-hour-a-day market analysis to institutional and private investors around the world.
It’s now been five-plus months into the global shutdown. By now, many people have tossed in the towel on some of their more lofty quarantine goals — such as, training for a marathon or writing an epic novel, as Shakespeare was rumored to have done with King Lear during the 16th’s century’s Bubonic Plague.
Another common disappointment has been learning to trade stocks. Turns out, the initial spike in first-time online day-traders was triggered by a fantasy of instant wealth. Writes one April 29 Fox Business article,
“I see people just jump in with a small amount of money and buy cheap stocks all the time because they heard someone talk about it going higher… And that is never a good investment idea. In fact, those things usually blow up. And that’s the kind of thing that really burns people to the market early on.
“I think too many people think they’re going to get in and just become rich overnight or they’re going to double or triple their account really quick… The thing’s a journey, it’s not a sprint.”
If you’re among these new traders — or you’re thinking of trying your hand in the craft — our free Trader Education Week event is where your journey begins.
On September 3-9, all Trader Education Week participants will get practical, on-demand video lessons from our log-time Trader’s Classroom editor Jeffrey Kennedy.
Combined, these 7 days’ worth of trading lessons will help any trader, in any market and skill level, to build a strong, stable foundation for understanding the difference between a high-confidence market opportunity versus a hard pass… while managing risk along the way.
Let us give you a little taste of what you get during Trader Education Week.
Below, see how your Trader Education Week instructor showed his Trader’s Classroom subscribers how to anticipate significant moves in a popular stock, Boston Beer Company (SAM).
To answer the critical question: “How do you identify the market’s trend?” in the March 4 Trader’s Classroom, Jeffrey showed this chart of Boston Beer since July 2019:

Jeffrey explained that price action had a countertrend look: a slow, choppy three-wave move contained within parallel lines. This set the stage for further selling in wave 4 — and then a new rally in wave 5:
“This argues for further decline back to below the wave A extreme of 336.10. The trend could be down for a number of weeks… but then will make way for further rally.”
From there, SAM indeed fell — and in the April 9 Trader’s Classroom lesson, Jeffrey confirmed the anticipated wave 5 rally was due and called for a move above $500 per share:

And, as the following chart shows, that’s exactly what SAM did:

This is just one example of MANY, the kind you’ll see during our Trader Education Week on September 3-9.
We may not be able to write a novel, but if learning to spot new consistent trading opportunities is a goal of yours — then our Trader Education Week is the place to start.
Join Trader Education Week now, free
This article was syndicated by Elliott Wave International and was originally published under the headline Come Out of the Pandemic in the Best (Trading) Shape of Your Life – Here’s How. EWI is the world’s largest market forecasting firm. Its staff of full-time analysts led by Chartered Market Technician Robert Prechter provides 24-hour-a-day market analysis to institutional and private investors around the world.

Mijn laatste analyse was op 30 april van dit jaar. Toen was ik niet enthousiast over het aandeel. Achteraf bezien toen goed gezien, maar begin juni veranderde het beeld en toen hoorde u niets van mij.
Er is nu een sterke stijgende trend waarop u mogelijk nog even kunt meerijden. Toch zou ik de hand aan de pols houden, want er komen nog twee weerstanden aan. Er ligt in de grafiek een gap op 36 en een top die doorbroken moet worden op 38.
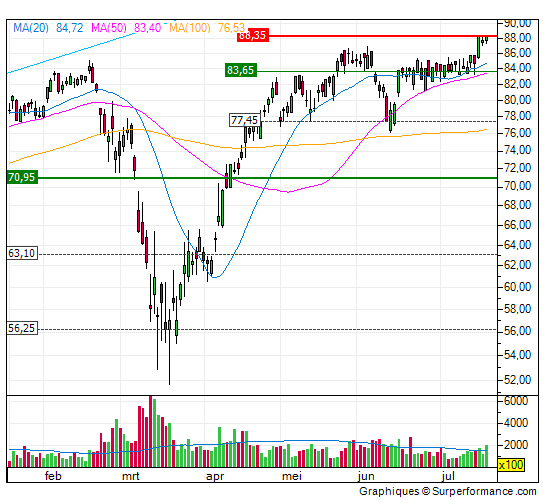
Een interessant moment… Als de koers vanochtend om 10:00 uur boven de slotkoers van vrijdag (88,35 euro) staat, dan is er wat mij betreft sprake van een koopsignaal. Stop loss daarna op 87.95 euro per aandeel leggen.


Het aandeel ING zit momenteel in een neutrale trend. De bovenkant is te vinden rond de 6,7 en de onderkant rond de 6 euro per aandeel. Ik zou hier geen positie innemen.

In de grafiek van het aandeel Aalberts is overduidelijk dat er een weerstand ligt op 30,5. Al drie keer, misschien zelfs vier keer eerder is de koers op dat niveau gestuit en ging daarna weer omlaag.
Ik zou hier dus nooit onder dat 30,6 long gaan. Liefst zelfs nog een dag wachten na de uitbraak.
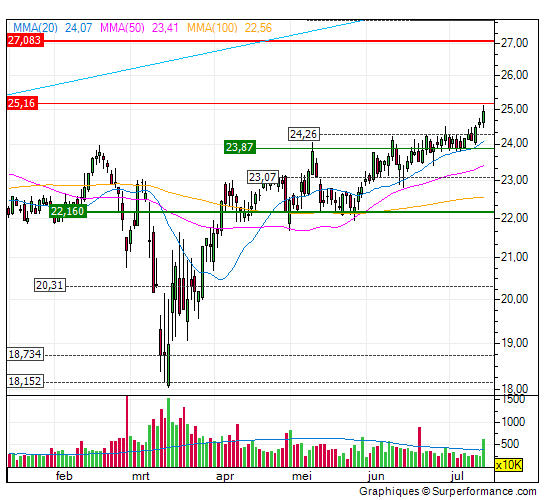
Het aandeel Ahold Delhaize is wat mij betreft technisch uitgebroken en koopwaardig. Laat de stop loss lekker meelopen en leg die 1,5 euro onder de hoogste slotkoers.