Get a FREE 7-day trip inside the Pro Services platform. See the latest analysis for 70+ most-traded markets:


Get a FREE 7-day trip inside the Pro Services platform. See the latest analysis for 70+ most-traded markets:
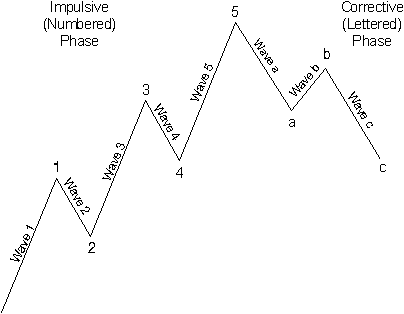
Elliott waves map out recurring patterns in price moves – in stocks, crypto, commodities & more.
Discover the method in @RobertPrechter’s Elliott Wave Principle, free from @elliottwaveintl:
Klik hier voor meer informatie
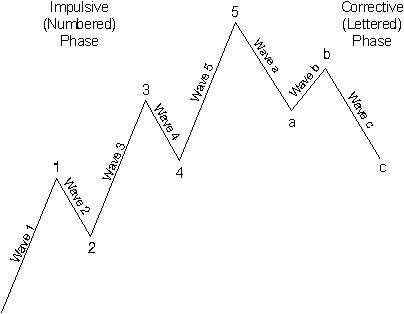
Hier een video over Elliott Wave. De video is in het Engels.
Mijn gemeente heeft besloten dat de beste plek voor een AZC een plek vlak bij mijn huis in het buitengebied is. Dat is lekker zeg… Lees hier mijn visie op hoe het tot nu toe gelopen is.
Dit weekend druk in de tuin geweest. Gras verticuteren, daarna twee kuub aan mos en gras naar de kippen, verder de moestuin frezen. Kortom, lekker de spieren aan het werk gezet in het heerlijke zonnetje.
Bayer heeft ooit Monsanto overgenomen en dat was één van de domste overnames ooit. Het bedrijf moet nu 2 miljard schadevergoeding betalen i.v.m. een Roundup zaak die ze verloren.
Meevaller voor Boeing. Ze mogen de volgende generatie straaljager gaan bouwen. Ik verwacht dat er buiten de Amerikaanse en Israëlische luchtmacht weinig animo voor het vliegtuig zal zijn.
VDL Nedcar gaat militaire drones bouwen. Er wordt ruimte gemaakt voor meerdere bedrijven die er militaire producten gaan produceren.
De Britse overheid gaat tienduizenden banen schrappen in een forse bezuinigingsmaatregel.
Italië lijkt niet langer in de markt voor Starlink diensten van SpaceX, het bedrijf van Elon Musk. De uitspraken en handelingen van Musk zijn de reden voor het afblazen van de overeenkomst.
In Turkije veel protesten nu Erdogan zijn belangrijkste politieke tegenstander uitschakelt.
Vrijdag een video gemaakt over Volkswagen en Toyota aandelen. Kijk hier

RULES are great. They tell you what you can’t do. The Elliott Wave Principle has three.
In a five-wave impulse (shown in the chart below):
Wave 2 can never retrace more than 100% of wave 1
Wave 3 can never be the shortest of waves 1, 3 and 5
Wave 4 can never end in the price territory of wave 1
But GUIDELINES tell you what’s PROBABLE. And that’s what you want to know!
For instance, the guideline of alternation states that if wave two of an impulse is a sharp retracement, expect wave four to be a sideways correction, and vice versa. The chart below illustrates.
Sharp corrections are almost always zigzags (single or double). Sideways corrections include flats, triangles and combinations.
Not quite ready for the quiz? We have a handy resource that can help — and it’s free for a limited time:
How to Use Elliott’s Rules and Guidelines to Label Charts Correctly
In this on-demand course, EWI veteran analyst Jim Martens gives you practical tools and tips to help you improve your wave application. It’s a powerful resource for newbies and experienced wavers alike.
Elevate YOUR Elliott! Access Jim’s course for free now. Klik hier.

Preview: Get access to Elliott Wave International’s 12 days of free gifts – now!
Our friends at Elliott Wave International just announced an exciting event for traders & investors. It’s called the “12 Days of Elliott Wave.” From December 1st through the 12th, you get free access to 12 premium educational resources. You’ll get a different one each day. Plus, a couple of welcome resources are available now!
Visit 12 Days of Elliott Wave to get in on the action:
Each of the gifts is a resource that people pay for, but during this special time of the year, they’re giving them away.
Klik hier om er van te profiteren!

Deze week is het de Trader Eduscation Week bij EWI.
Zoals ze zelf zeggen:
Trader’s Classroom helps subscribers learn the Wave Principle, and apply it in real time. And that is exactly what Trader Education Week offers you and your followers, directly from six of the world’s best wave instructors. What’s more … it’s free.
Kijk hier

Every day, you read news stories about the state of the economy and the stock market affecting consumer and investor behavior. The story goes something like this: When the economy and financial markets show signs of improvement, consumers start to spend more, and investors buy stocks.
But if you’re a student of Elliott waves, you understand that this type of thinking is precisely backwards. It’s consumer optimism and the resulting consumer spending that elevates the economic markets; and it’s the investors’ bullish mood that translates into a rising stock market as investors buy stocks.
Social mood, in other words, comes first. Consumer and investor behavior — bullish or bearish — follows.
That’s why social trends can give you clues as to where the financial markets are likely heading next. For example, exuberant investor optimism often appears near major stock market tops, while deep pessimism accompanies major lows.
Let’s look at a key European market as an example. Back in March, the pan-European Stoxx Europe 600 index extended its rally to seven consecutive weeks. Most investors probably saw the strength as a reason to load up on European stocks. Readers of our European Financial Forecast, on the other hand, saw warning signs of exuberance flashing throughout society.
First, Lamborghini’s 2023 sales results showed an all-time record 10,112 cars sold last year. Lamborghini’s electric V12 Revuelto is sold out until late 2026 — a three-year wait! Luxury goods tend to be popular at extremes in positive social mood, as the stock market and economic prosperity approach major peaks. They tend to go out of favor when these trends reverse.
Second, a March 10 Bloomberg headline said, “One of the Most Infamous Trades on Wall Street Is Roaring Back.” The trade in question was the so-called short volatility trade, where traders sell products that track stock volatility. “Investors are sinking vast sums into strategies whose performance hinges on enduring equity calm.” According to data from Global X ETFs, short volatility bets nearly quadrupled in two years.
“Enduring equity calm” attitude among investors rang a bell. We had been here before. An earlier iteration of the same trade famously blew up on February 5, 2018, when the CBOE Volatility Index (VIX) suddenly spiked 20 points and destroyed vast numbers of professional and retail portfolios. The spike coincided with a global stock market sell-off and a two-and-a-half-year period of volatility that left the S&P 500 where it started. In Europe, the Stoxx 600 had peaked three years before the S&P, so the stretch of zero returns lasted nearly six years. This chart of Europe’s VIX equivalent, the VStoxx Implied Volatility Index, illustrates a few of the infamous volatility spikes over the past quarter century.

In our view, the re-emergence of the short-volatility casino is a much larger version of 2018. Five years ago, traders were gambling with a little more than $2 billion within a small handful of funds. Today, a mind-blowing $64 billion is being bet using “ETFs that sell options on stocks or indexes in order to juice returns” (Bloomberg, 3/10/24). Whether they know it or not, these traders are relying on smoothly functioning markets that behave the same way today and tomorrow as they did yesterday or the day before.
The warning signs we see in investor and consumer behavior are worth heeding.
To predict the next move in European markets, I’ll continue to monitor social trends for clues. But more importantly, I’ll compare the Elliott wave price structures in stock market indexes to previous major junctures in those indexes. Tune in to The European Financial Forecast for my ongoing analysis, or sign up for our free newsletter, and I’ll send you occasional updates like this.
This article was syndicated by Elliott Wave International and was originally published under the headline Stoxx Europe 600: What Signs of Investor Exuberance Keep Telling Us. EWI is the world’s largest market forecasting firm. Its staff of full-time analysts led by Chartered Market Technician Robert Prechter provides 24-hour-a-day market analysis to institutional and private investors around the world.
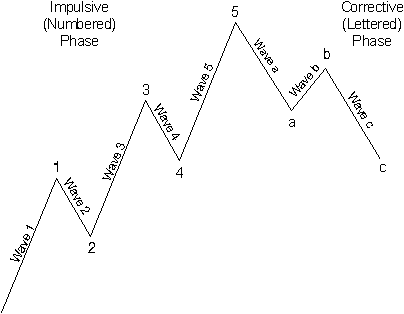
In dit Engelstalige artikel laat de analist van Elliott Wave zien dat we nu, veel meer dan in 1929 en 1987 in de beurshandel betrokken zijn.
Beurshandel is genormaliseerd, daar waar het eerst vooral de rijke elite was die er actief in was.
Dat is opmerkelijker dan we zouden denken, want er zijn ook tijden geweest dat aandelen echt ‘not done’ waren voor de gewone bevolking.
Toen ik zelf ging beleggen in 1987 moest ik op kantoor bij de bank komen voor de broker rekening ook maar geopend zou worden. Ik betaalde 42 gulden per transactie. Het was dus echt alleen een buy and hold opzet indertijd.
Kijk hier naar het artikel.
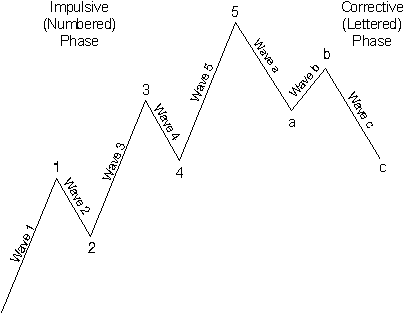
Although it doesn’t feel like it sometimes, the U.S. stock market has been in a downtrend since January 2022.
The reason it doesn’t feel like it is because the S&P 500 has been in a narrow trading range between about 3700 and 4300 for more than six months — going back to at least November.
Some observers believe a narrow trading range will persist (Reuters, May 24):
Stocks set for range trading as central banks near end game: Reuters poll
Unsurprisingly, some believe that if stocks break out of this trading range, it will be to the upside.
The strong rally on June 2 — when the Dow Industrials surged more than 700 points — certainly lends credence to that bullish opinion.
Of course, there’s the possibility that more upside is ahead.
However, in addition to using Elliott wave analysis, Elliott Wave International regularly reviews dozens of market indicators and we see a lot of red flags for the market.
If, indeed, the bear market is not over, which sectors will lead the way lower?
Well, one of the prime candidates is the banking sector.
Back on March 17, the Elliott Wave Theorist, a monthly publication which covers major financial and cultural trends, showed this chart (wave labels included for subscribers) and said:

It is well to keep in mind how fragile the banking system is. … [The chart] shows that the banking sector is emerging as a downside leader.
As I write on June 5, there’s nothing about the index’s price action which would alter our March analysis.
Another sector to keep in mind is technology.
As the June Elliott Wave Financial Forecast, a publication which covers major U.S. financial markets, noted:
The NASDAQ’s recent outperformance is dramatic relative to the market’s most senior stock index, the Dow Jones Industrial Average.
Of course, the NASDAQ is dominated by big tech names. If they finally reverse, keep in mind that sectors which lead on the upside often turn around and lead on the downside.
A key way to keep on top of the NASDAQ (as well as other stock indexes) is to employ the Elliott wave model.
If you’re unfamiliar with Elliott wave analysis, read Frost & Prechter’s Elliott Wave Principle: Key to Market Behavior. Here’s a quote from the book:
All waves may be categorized by relative size, or degree. The degree of a wave is determined by its size and position relative to component, adjacent and encompassing waves. [R.N.] Elliott named nine degrees of waves, from the smallest discernible on an hourly chart to the largest wave he could assume existed from the data then available. He chose the following terms for these degrees, from largest to smallest: Grand Supercycle, Supercycle, Cycle, Primary, Intermediate, Minor, Minute, Minuette, Subminuette. Cycle waves subdivide into Primary waves that subdivide into Intermediate waves that in turn subdivide into Minor waves, and so on. The specific terminology is not critical to the identification of degrees, although out of habit, today’s practitioners have become comfortable with Elliott’s nomenclature.
Get free access to the entire online version of this Wall Street classic by signing up for a free Club EWI membership.
In case you don’t know, Club EWI is the world’s largest Elliott wave educational community and members enjoy complimentary access to a wealth of Elliott wave resources on investing and trading.
Get started by following this link: Elliott Wave Principle: Key to Market Behavior — get free access.
This article was syndicated by Elliott Wave International and was originally published under the headline Will These 2 Sectors Lead the Stock Market Lower?. EWI is the world’s largest market forecasting firm. Its staff of full-time analysts led by Chartered Market Technician Robert Prechter provides 24-hour-a-day market analysis to institutional and private investors around the world.